
DECISION MACHINE LABS
Dissipation in Financial Markets
Introduction
Evidence that financial markets are not in equilibrium or even in near equilibrium is all around us. In fact, it is not particularly hard to understand why many assets on financial markets should behave as open, non-equilibrium systems. In the next section, we’ll explain what open, non-equilibrium means, and how to apply it to financial markets (or in fact any market).
There are three behaviors associated with non-equilibrium thermodynamics: chaos, oscillation, and propagation. This post is focused on thermodynamic oscillations because they are useful (profitable), self-regulating and not difficult to find in NYSE and NASD closing price time-series data. Scientific measurements provide signals for large alpha events, simply by navigating markets with more awareness of the environment.
In the last 50 years significant progress has been made in non-equilibrium thermodynamics (Prigogine, Crooks, Jarzynski, many others). In far-from-equilibrium systems, oscillation is due to the same dissipative processes that, in an isolated system, wipe out all inhomogeneities and drives the system to statistical equilibrium. The creation and maintenance of organized structures (like oscillations) in open non-equilibrium systems are due to dissipative processes, and therefore are called dissipative structures. Advances in non-equilibrium thermodynamics have yet to appear in conventional market analyses, to the best of our knowledge. ScienceML implements the Science of Counting to give an unbiased scientific analysis of an open system and environment by processing time-series.
In Section three we plot the ScienceML decomposition for closing price time-series to better observe the dissipative structure.
Open, Non-equilibrium Financial Markets
Table 1 below compares the different types of scientific systems: isolated, closed, and open. For me the takeaway is always the same: financial markets (and anything else of interest) are going to be more dynamic than a cold cup of coffee (closed system). Financial markets must surely be an open system. However, our current toolset (statistics, conventional machine learning and AI) is not designed for open systems, and only obscures our understanding of them.
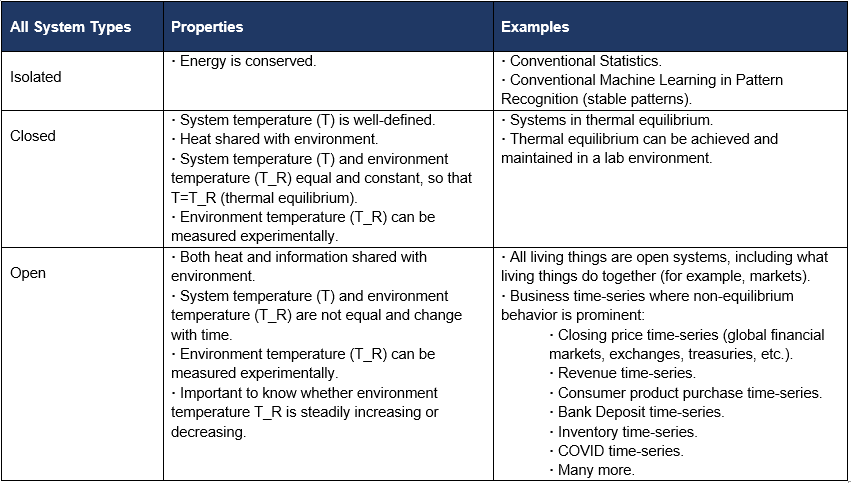
Table 1. Compares the different types of scientific systems: isolated, closed, and open.
Open systems are generally not in equilibrium and are non-linear, and therefore assumed to be difficult to solve. But this is not true for every open system problem. One of the generous takeaways from an undergraduate physics major is the Science of Counting. The Science of Counting provided many problems in the undergraduate curriculum that work out particularly well and simply, often with just algebra. The Science of Counting was applied to the theory of electrical circuits (pre-Maxwell, pre-electron, circa Kirchoff), although simplified considerably by assuming thermal equilibrium. The deeper message to undergraduates was that the Science of Counting is really thermodynamics.
The Science of Counting processes time-series and gives exact expressions for scientific measurements as an unbiased mathematical description of our system and environment.[1] Look at financial markets specifically (Figure 1). Inside the circle in Figure 1 is our non-equilibrium trading system driven by energy and temperature, E and T, and interacting with a temperature and information reservoir (outside the circle). The trading environment can be taken to be very inclusive (media, monetary policy, on and on), but they all roll up to a single number, T_R, the temperature of the reservoir.
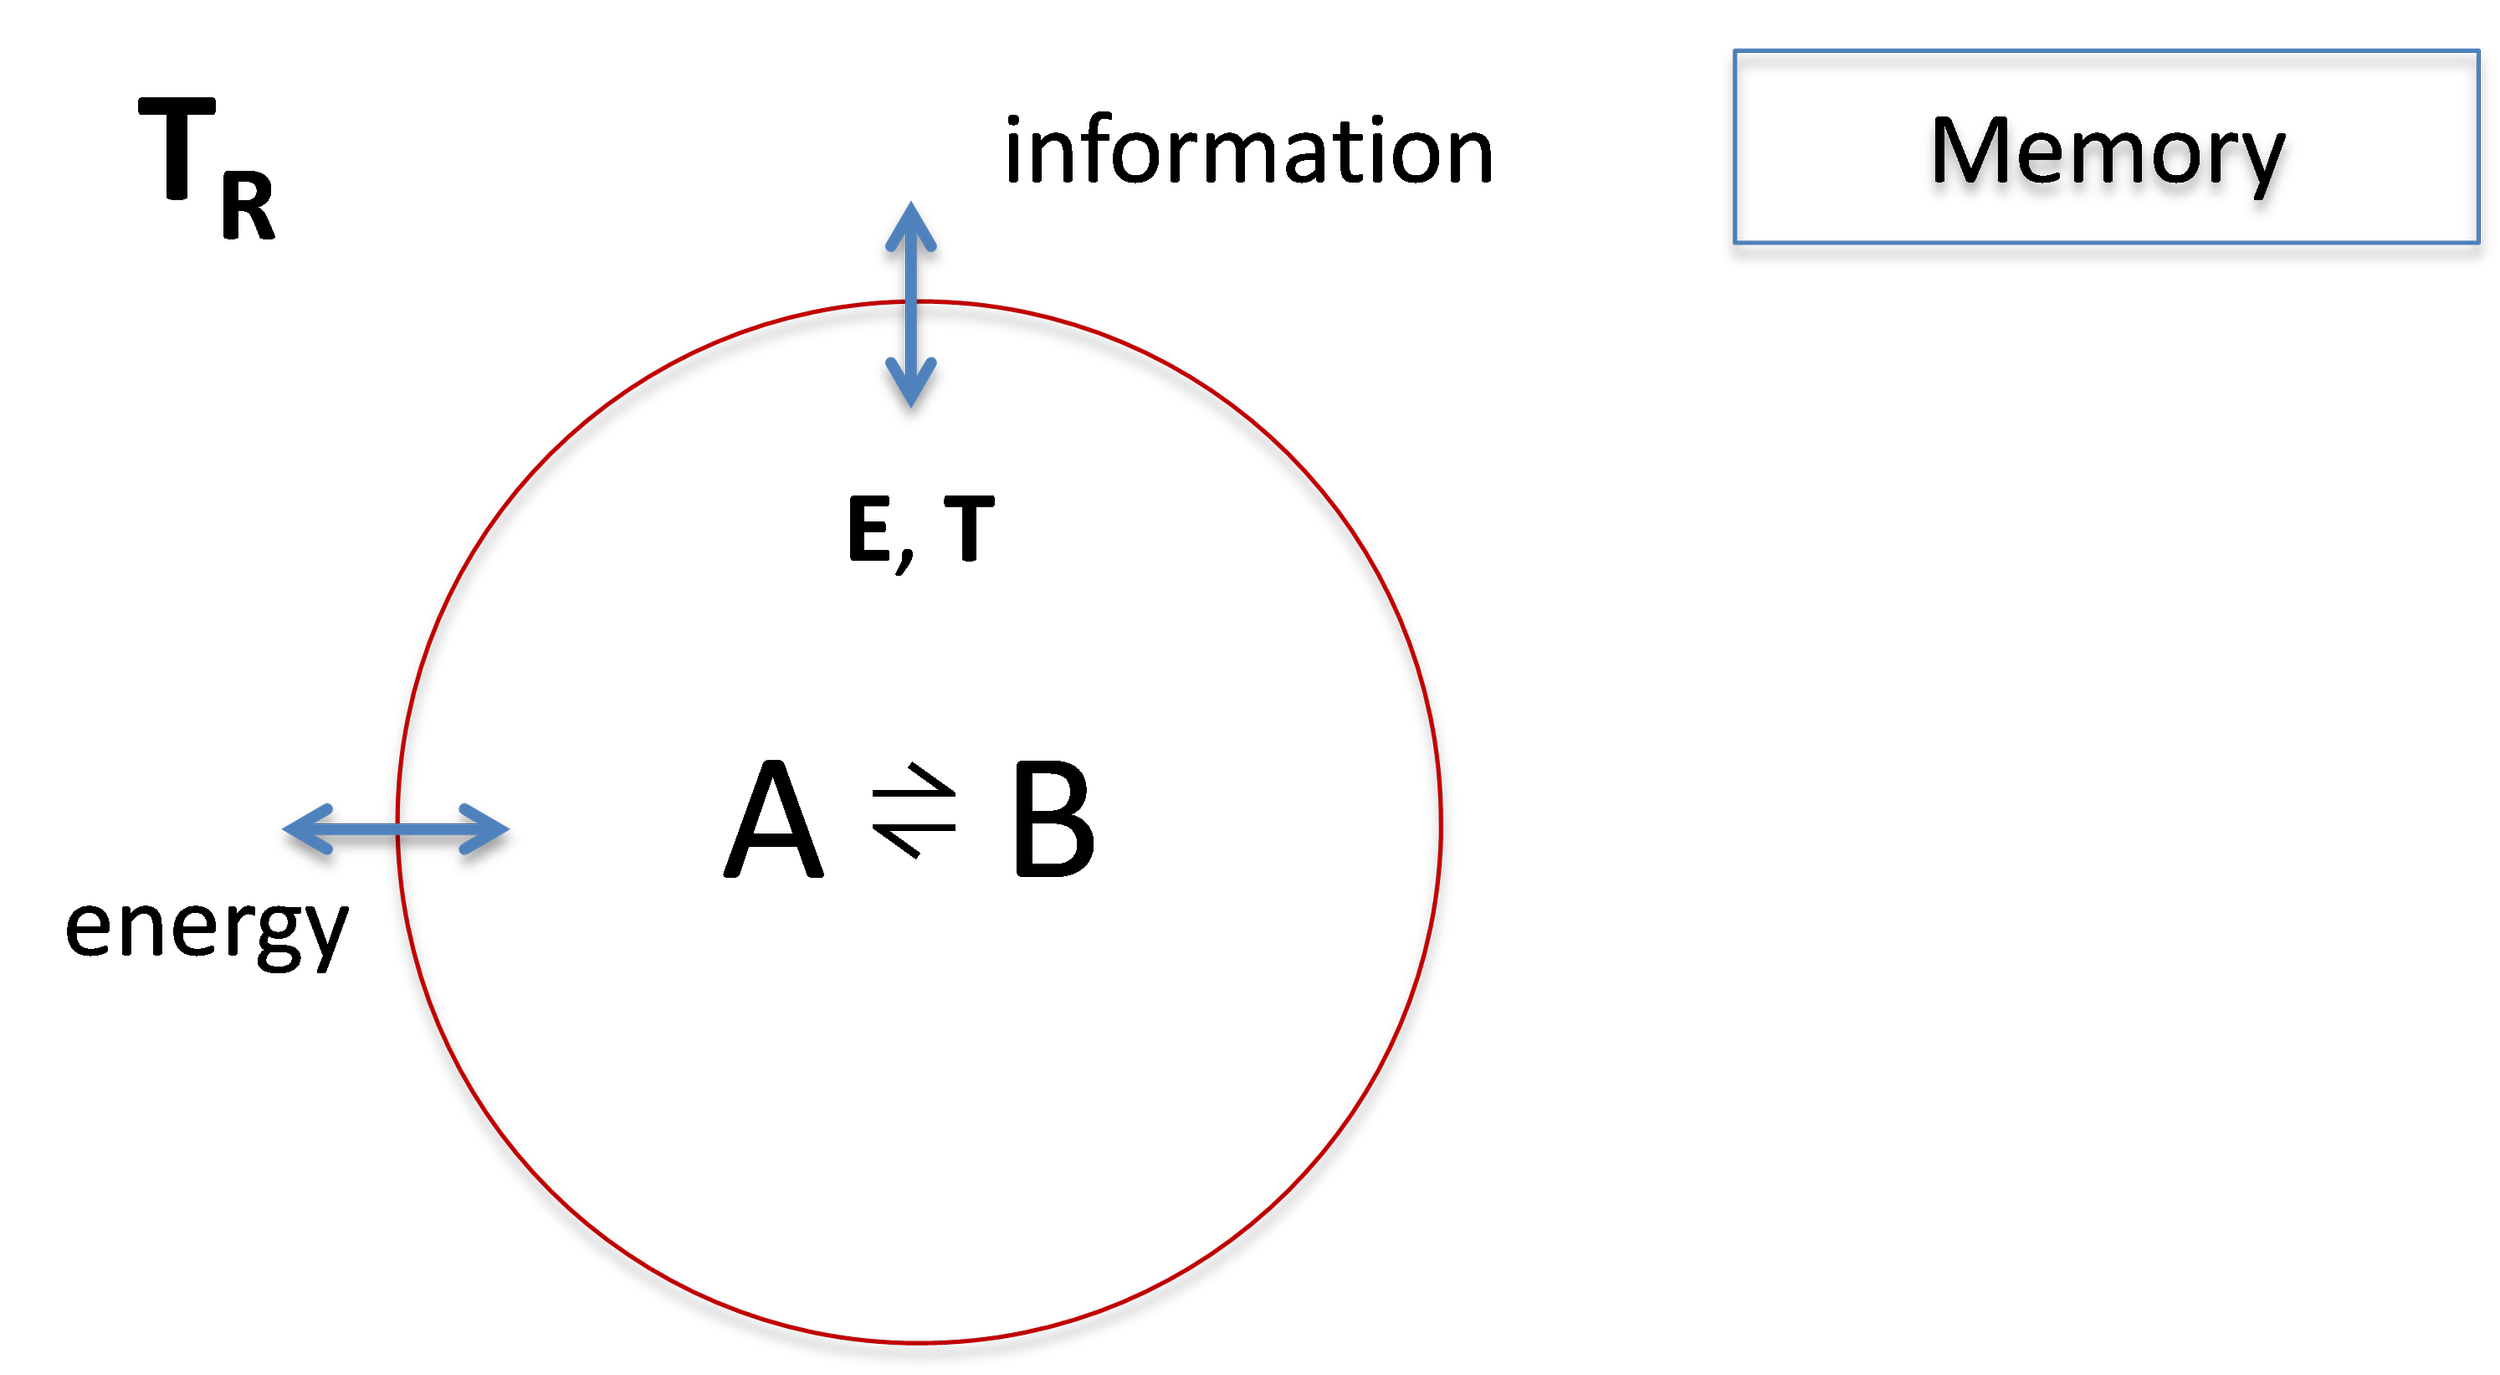
Figure 1. Architecture of the financial market open system.
From the time-series, the energy and temperature, E and T, can be calculated exactly. Also, the temperature of the reservoir, T_R, can be measured directly (next section). In general, the temperature of the system and the temperature of the environment are not the same: T ≠ T_R . No coffee at room temperature.
The non-equilibrium process of interest here is Loss ⇌ Gain.
Our objective is to compute from closing-price time-series the reaction rates (both forward and backward) for Gains and Losses. One technical assumption is made on the exchange of energy and information between the system and the environment: that it is reversible. The energy and information are reversible if neither energy nor information can be deleted between the system and the trading environment. Memory stores system and environment information, like the daily closing price, so that it is not forgotten (a form of deletion).
Dissipative Structures: Plots
Figure 2 (below) plots the probabilities and the energy of a closing price time-series. Six months of closing price data for stock symbol ZIM (bottom plot) is processed by ScienceML and plotted. Note that out of six months of data, only the last three months of processed data are plotted. The middle plot is the energy; the energy is zero at statistical equilibrium. The top plot presents two different types of probability: mechanical (dotted) and thermal (solid). Observe that when the thermal probability dominants the non-thermal probability, the thermal probability drives the price movements. Look at Figure 2. The dominant thermal probability is the reaction rate for the Loss ⇌ Gain reaction that we were seeking in the previous section.
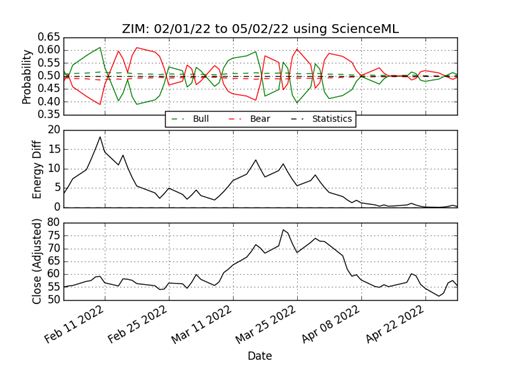
Figure 2. Market closing prices (input, bottom plot) for ZIM. Energy measured from equilibrium (middle plot). Both non-thermal (green/red dotted) and thermal probability (green/red solid) are in top plot.
Figure 3 below plots the temperature and the free energy for the same closing price time-series data used in Figure 2 for ZIM. The system temperature and free energy are well-defined and calculated. The free energy is the energy available to do price movement work. When free energy is falling, free energy is doing price movement work and increasing the internal temperature. Note that neither the temperature nor the free energy is constant over the time duration. Heat both enters and exits the system.
This is characteristic of a thermodynamically open system. From the data, ZIM has operated out of, and often far from, statistical or thermodynamic equilibrium (steady state) in an environment with which it exchanges energy and information. The temperature of the external trading environment is denoted by T_R.
A thermodynamically open system is said to be a dissipative structure when it has a dynamical regime that is in some sense oscillatory. That behavior is present in Figure 3.

Figure 3. Plots of temperature and free energy over three months using six months of closing prices. Provides evidence that asset prices for ZIM have been far from either statistical or thermal equilibrium.
The temperature of the system, T, and the temperature of the external trading environment (T_R) are generally different. However, the two temperatures are the same when the system is in thermal equilibrium. In the Figure above, there is an interval in March when the temperature and the free energy of ZIM are constant; this is thermal equilibrium with the trading environment. Thermal equilibrium provides a measurement of the temperature of the trading environment, in this case, T_R = 0.6809, approximately.
Conclusion
In the first week of January 2022, Precision Alpha analyzed all symbols on the NYSE and NASD using ScienceML. The analysis focused on symbols that had non-thermal probability greater than 0.51 or less than 0.49 for an entire year. In each exchange, roughly one third of all symbols (about 800 symbols on NASD, and 700 symbols on NYSE) were found to satisfy that (somewhat arbitrary) threshold. And of those symbols, all were found to have evidence of dissipative structures, both bullishly and bearishly. In January 2022 at least one third of the stocks on NYSE and NASD displayed strong open thermodynamic behavior.
Precision Alpha’s analysis suggests that asset prices that behave as dissipative structures are common on the NYSE and NASD.
This is the beginning. We hope this makes you curious about your own time-series, financial or otherwise.
We don’t have a handle on open systems until we have explored all time-series we can lay our hands on in a systematic way. The exploration and mining of value must be done by all of us. Process any time-series (vertical agnostic) using the Precision Alpha On-Demand product. What are we going to find?
Bibliography
[1] M. Temple-Raston, ScienceML from Decision Machine, DM/PA Technical Whitepaper (www.precisionalpha.com/ScienceML).